Instant, field-wide soil analysis.
Get comprehensive nutrient heatmaps, statistics, and insights using satellite imagery. No physical sampling required. Results in minutes.
See pricing ->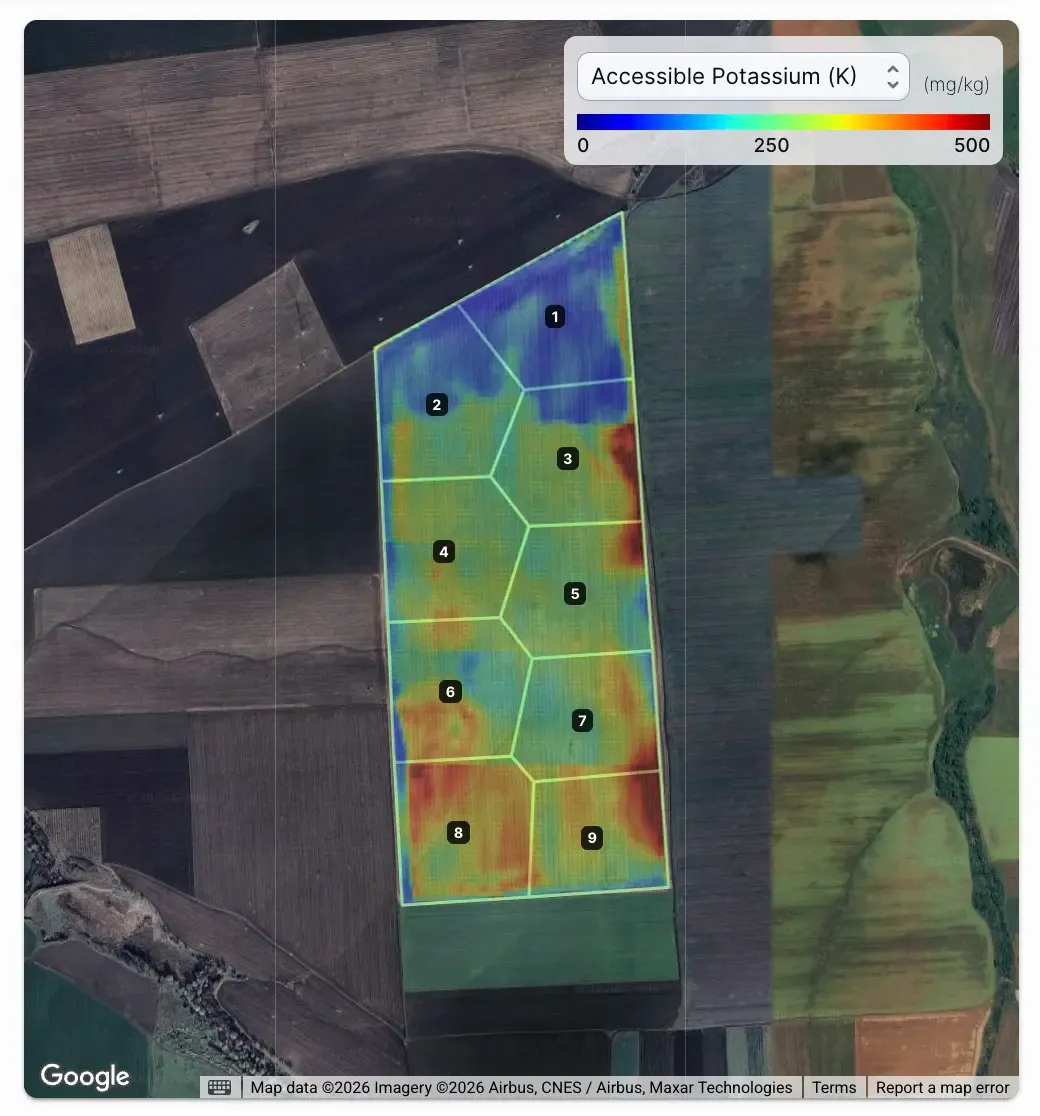
Select Your Field
Draw or upload SHP
Wait For Your Analysis
Processed in minutes
Get Soil Intelligence
Nutrient maps, stats & exports
Overview
What you get, at a glance
Field-Wide Soil Data
See the full picture with high-resolution grids.
- Heatmaps at ~10 m Resolution
- Nutrients, Chemistry, Texture
- Full-field Coverage
Field Statistics
Understand variability with statistical breakdowns.
- Median Values Per Field
- Zonal Averages
- Distributions
Interpretations
Automated insights to speed up your decision making.
- Strengths and limiting factors
- Management opportunities
- Weather context (historical + forecast)
Outputs and Continuity
Export data to your machines or access it in your account.
- CSV, PDF, Shapefile exports
- Historical analysis (up to 3 years)
Applications
Decisions you can make with field-wide soil data
From fertilization planning to land assessment and reporting, without field visits or long sampling cycles. Need to track crop response over time too? See Vegetation Index Monitoring.
Use Case
Fertilization and zoning decisions
See nutrient variability across the whole field so you can decide if, where, and how much to fertilize.
Best used to reveal within-field differences that point sampling can miss.
Use Case
Land assessment before purchase or lease
Screen and compare fields remotely before committing to visits, sampling logistics, or negotiations.
Use field-wide maps plus historical context to reduce one-date bias.
Use Case
Export soil layers for reporting and models
Get consistent field-wide soil layers for analytics, benchmarking, or sustainability reporting.
Use exports to integrate into your workflow, and open datasets for validation.
Why Siora
Why move beyond point sampling?
Traditional sampling leaves most of the field unknown. Siora creates a virtual soil sample, a dense field-wide estimate grid that reveals variability point samples miss.
See full comparison table| Feature | Siora Satellite | Traditional Lab |
|---|---|---|
| Coverage | Field-wide (100%) | Points (<1%) |
| Turnaround | ~5 minutes | Days to weeks |
| Logistics | Remote, no sampling | Manual sampling |
Demo
Explore sample report
Interact with a full demo report including heatmaps, statistics, and downloadable exports.
Note: example output for demonstration. Use alongside lab sampling, not instead of it.
Cross-sell
Pair soil analysis with vegetation monitoring
Soil analysis tells you what the ground has. Vegetation monitoring tells you how the crop is responding, week by week, throughout the season.
11 vegetation indices, updated weekly
Subscribe a field once and get NDVI, NDRE, NDMI, EVI, and 7 more indices for every clear-sky satellite acquisition. Up to 3 years of historical imagery is processed at activation, and the dashboard refreshes weekly through the subscription year.
- ✓Spot stress early: drought, disease, or nutrient deficiency before they show in yield.
- ✓Track recovery: see how the crop responds after fertilization, irrigation, or weather events.
- ✓Compare seasons: 3 years of historical context for benchmarking and trend analysis.
North Field 42
2026 Growing Season
0.71
Mean NDVI
11
Indices
3 yr
History
Contact
Get in touch with us
For inquiries about our analyses, partnerships, or reseller opportunities, please reach out using the form below.