Satellite crop monitoring for every field you grow.
Eleven vegetation indices, computed weekly on every field you subscribe. Plain-language insights and 3 years of history land on day one.
North Field 42
2026 Growing Season
0.71
Mean NDVI
11
Indices
3 yr
History
Weekly Sentinel-2 updates
~10m resolution. Every 5 to 7 clear days.
11 vegetation indices
All eleven, every clear date.
3 years of history
Backfilled automatically on day one.
Interactive dashboard
Heatmaps, histograms, trends, year-over-year.
Plain-language Insights
Generated in your account language.
Data exports
CSV and shapefile. Any date, any index.
Season Guide
How the indices help, stage by stage
Different indices answer different questions, and which question matters depends on where the crop is in the season. Here's what to look at when, and what each index actually tells you.
Establishment
Crop is just emerging. Canopy is partial, soil is still visible underneath, and standard NDVI reads the soil more than the plants.
MSAVI
adjusts for visible soil so you get a real read on early canopy.
OSAVI
flags uneven or slow emergence across the field.
Soil chemistry shapes how this stage goes. If you have Soil Analysis subscribed, Insights cross-references both layers automatically.
Vegetative growth
Canopy is closing. The crop is building biomass and pulling nutrients hard.
NDVI
tracks general vigor and field-wide density.
NDRE
picks up nitrogen and chlorophyll shifts before they show in greenness.
GNDVI
confirms chlorophyll changes and nitrogen uptake.
Reproductive / peak canopy
Crop is at peak biomass. NDVI saturates here, and water stress can do real damage fast.
EVI
keeps separating good from very good when NDVI flatlines.
NDMI
measures canopy moisture, the early water-stress signal.
MSI
confirms stress severity. Read NDMI and MSI together.
Maturation and senescence
Crop is winding down toward harvest. The question shifts from “is it healthy” to “is it on schedule.”
NDVI
decline shows the senescence curve.
Year-over-year overlay
shows whether the curve is early, late, or on track vs the same stage last year.
Understand Your Crops
Three ways teams use the dashboard
In-Season Management
Catch stress before it shows
Cross-check NDRE, NDMI, and MSI to separate nitrogen, water, and general stress. Decide where to scout this week.
Pairs with: weekly Insights and side-by-side index views.
Treatment Validation
See whether what you did worked
Run an irrigation or fertilizer event, then watch the next two or three acquisitions. The trend chart turns “I think it helped” into a measurable response.
Pairs with: the trend chart and before/after compare.
Season-Over-Season Planning
Build a record you can plan against
Compare this season's curve to the same period last year. Useful for benchmarking, sustainability reporting, and next-season decisions.
Pairs with: the full-history view and year-over-year overlay.
Index Reference
11 indices, picked by the question you're asking
Different indices respond to different things. The value of having all of them is that you can ask sharper questions and get better answers.
“What's the headline number for this date?”
Quick read across the field. NDVI is the anchor; EVI helps when canopy is dense.
“Is nitrogen off before it shows in greenness?”
Chlorophyll-sensitive. Catch deficiency 1 to 2 weeks earlier than NDVI.
“Is the canopy under water stress?”
NDMI for moisture content, MSI for stress severity. Read together.
“Is the crop establishing evenly?”
Soil-adjusted. Reliable when canopy is patchy and soil is showing.
“Where should I scout this week?”
Anomaly hunting: zones that diverge from the field mean or from last pass.
“Where do I split my nitrogen this season?”
In-season zoning for variable rate. The actual decision NDRE was made for.
“Is salinity building up in problem zones?”
Salt accumulation flags, especially on irrigated or coastal fields.
Siora Insight
Every clear-sky acquisition gets an Insight
Generated in your account language. Three parts:
What it means
What the field is doing right now, in one paragraph.
Action plan
One to three concrete next steps. “Scout the southern third this week.” Not advice, instructions.
Detailed analysis
Which indices moved and how, against the previous date and the same period last year. Soil data when you have it.
Split View
See vegetation and soil side by side
Vegetation tells you how the crop is performing. Soil tells you why. With Siora's split view, you can put any vegetation index next to any soil property on the same field, on the same screen.
Available on any field that has both an active vegetation monitoring subscription and at least one Siora soil analysis. If a field doesn't have a soil analysis yet, you can order one directly from the split view.
Learn about soil analysis →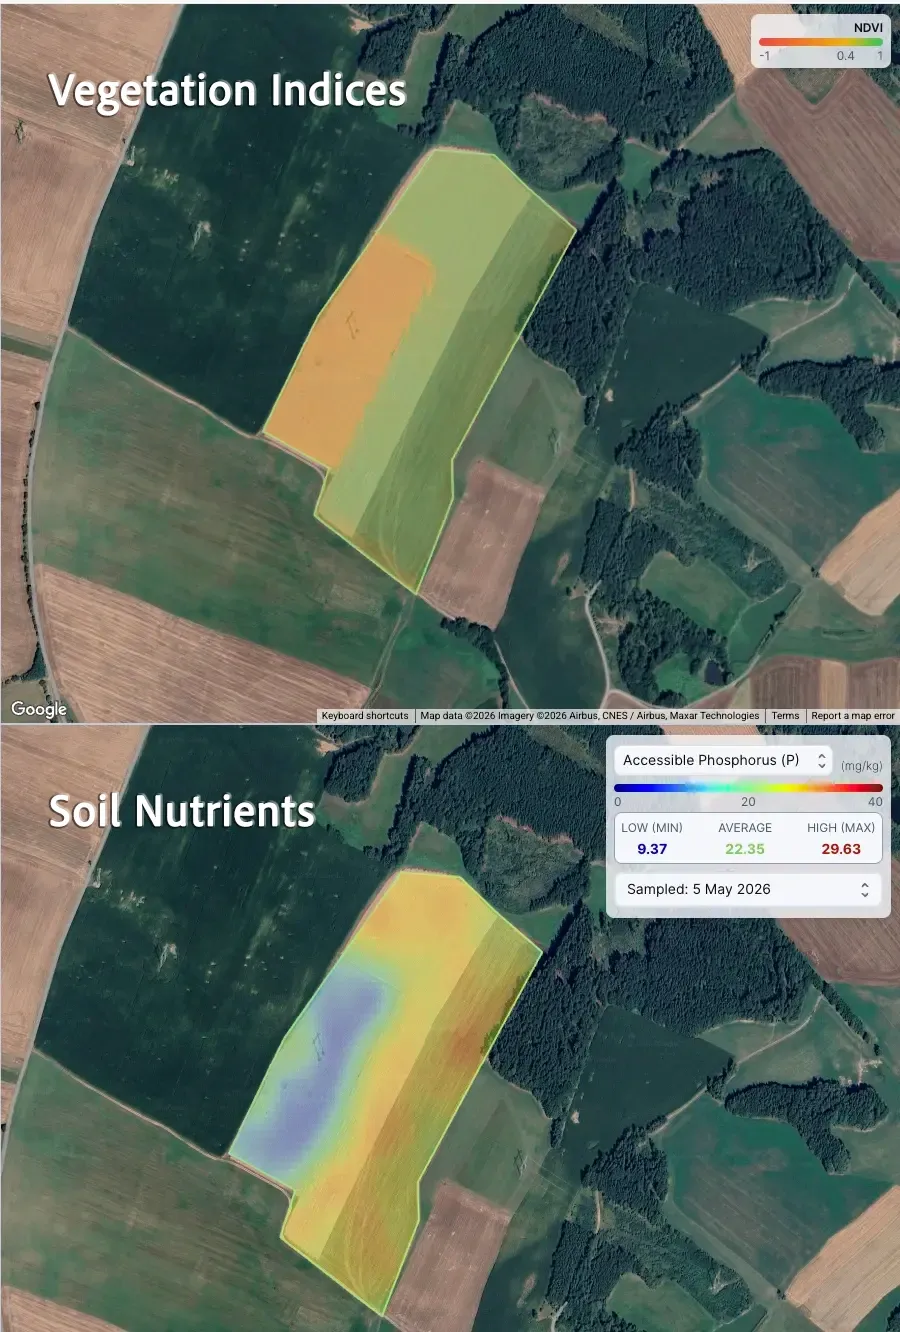
NDRE next to Nitrogen. See whether the field's chlorophyll patterns line up with measured nitrogen variability, or point to something else.
NDMI next to Soil Organic Matter. Check whether dry zones in the canopy match low-SOM areas where water-holding capacity is limited.
MSAVI next to pH. Spot whether weak early establishment correlates with pH-stressed zones.
Onboarding
How a subscription works
Minutes
Subscribe a field
Draw the boundary or upload a shapefile on app.siora.ai. Yearly billing per hectare.
Same Day
Activation, day one
Siora pulls up to 3 years of clear-sky imagery and runs all 11 indices on every usable date.
Same Day
Dashboard opens
The latest acquisition lands first with its Insight. Earlier dates fill in behind it.
Ongoing
Weekly updates
New acquisitions process automatically. No action needed.
Dashboard
What's in the dashboard
- All 11 indices on every clear date
- Health classification and distribution histograms
- Trend charts at 1 month, 3 months, 1 year, full history
- Year-over-year overlay
- Siora Insights on the latest date
- CSV and shapefile export
North Field 42
2026 Growing Season
0.71
Mean NDVI
11
Indices
3 yr
History
See real monitoring on a real field.
A full season of acquisitions, 11 indices, and Insights. No sign-up required.
FAQ
Frequently asked questions
How often will I get new data?
Sentinel-2 revisits every few days, but only clear-sky acquisitions are usable. Expect roughly weekly updates in good weather and less in cloudy stretches. Ingestion is automatic.
How long does activation take?
Up to 3 years of historical imagery is processed on day one. Small fields in sunny regions: minutes. Large fields in cloudy regions: longer. The dashboard opens as soon as the first date lands.
Is there a minimum field size?
No. Smaller fields have fewer pixels per date but get the full dashboard, all 11 indices, and Insights.
Does this replace ground scouting?
No, and it shouldn't. Monitoring tells you where and when to scout. Walking the field tells you what's actually there. Use both.
Can I export the data?
Yes. CSV for the full time series across all dates and indices. Shapefile for georeferenced points on any index on any date, ready for GIS or precision-ag tools.
What languages does Siora Insights support?
Insights are generated in your account language.
Where does this work?
Across 33 European countries today. Sentinel-2 covers most of the world's land, so other regions can be enabled on request.
How does this fit with Siora's soil analysis?
Soil analysis tells you the field's underlying chemistry and texture. Vegetation monitoring tells you how the crop is responding to it, week by week. The Insight engine reads both when both are available.